data engineering
numerical modeling
distributed systems
parallel computing
vector graphics
web apps
climate science
reactive transport
data visualization
fluid dynamics
welcome to navah dot site :)
My name is Navah (NA-vah, rhymes with 'lava'). This website is a showcase (or storage space) for projects and activities. I am particularly interested in data architecture, sewing, and medieval/early modern history.
Currently working in Chicago as a Senior Data Engineer. It's a solid mix of work all over the data and computing stacks. My role keeps me challenged which is an absolute must.
I build predictive numerical models of systems that can't be directly observed. I love automating, parallelizing, and debugging (not just that feeling at the end, but that too).
My PhD research in computational geophysics ( University of Chicago, 2020 ) applied tried-and-true numerical methods to new questions in climate science. Other scientific exploits include fluid dynamics of Earth's mantle and evolutionary biology.
If you came here looking for JokesByDad, Ted Cruz fanfiction, Ben Bernenke fanfiction, or Climate Shawty, I'm sorry to report that those projects have been retired. I am still the Climate Shawty, that's not going to change, but I've stepped down in an official capacity.
quick facts
Location: Albany Park, Chicago, IL
Work: Senior Data Engineer
From: Massachusetts/Connecticut/New York
Education: PhD in Geophysics 2020, University of Chicago
Summer bike: 1989 Ciocc
Winter bike: Wabi Classic
data viz.
spider plots
I used d3 (Data-Driven Documents) to make an interactive web-based visualization of various tropes found in movies on the Lifetime network.

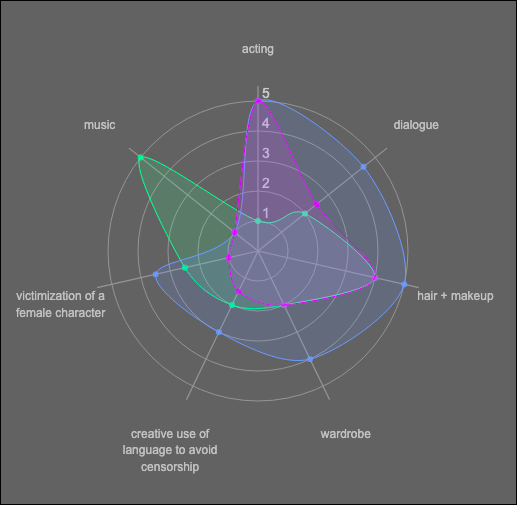
Lifetime is television for women. I had access to a proprietary algorithm to evaluate them.
But how do individual Lifetime movies compare to each other? I used d3 to make an interactive web-based visualization for some perspective. Here are some screenshots!
No live link until I get the OK, but you have to believe me that it's cool.
data viz.
matplotlib styling
Stylesheets (or manual styling) can make 3d matplotlib plots a lot more readable.

graphic design
graphics
Graphics I've made have ended up on the web, on print materials, on t-shirts, and on many, many, many stickers.
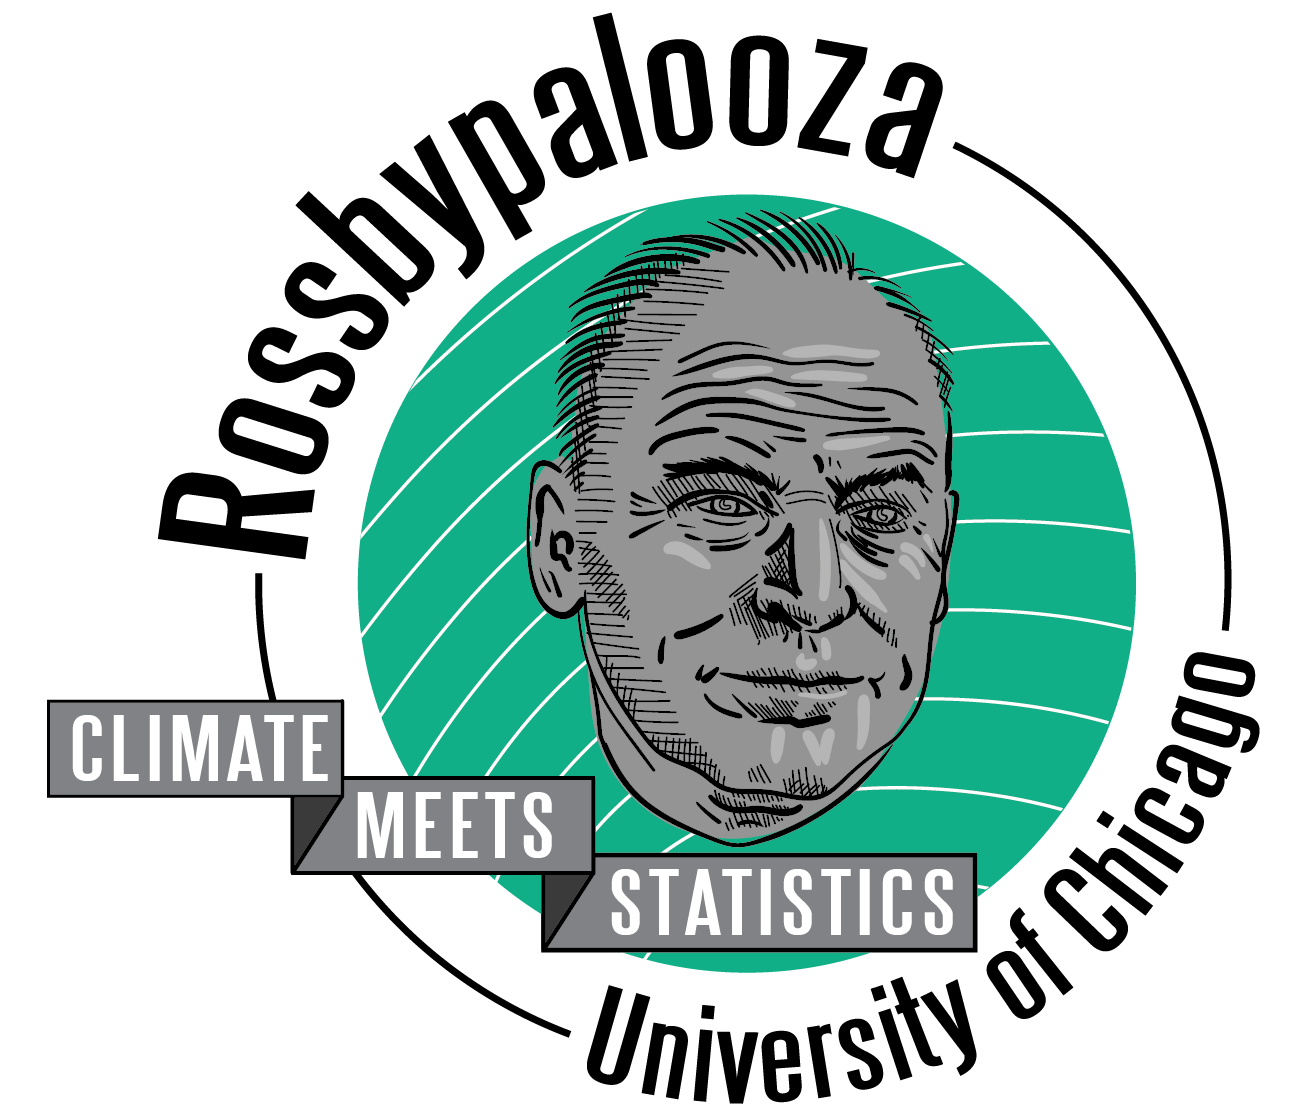
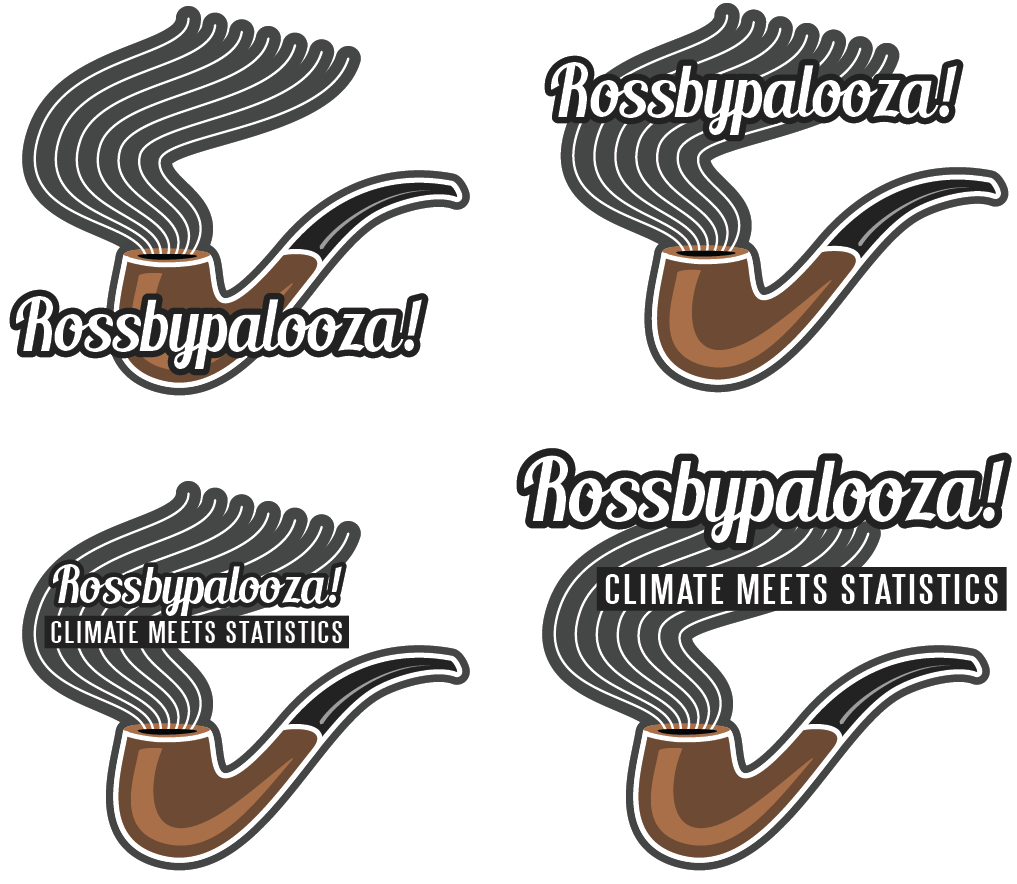
Rossbypalooza brought climate scientists and statisticians together for a few intensive summer weeks to collaborate! The visuals I made for merch and badges feature atmospheric fluid dynamicist Carl-Gustof Rossby (1898-1957). His pipe was iconic.
Menus and misc. other printed materials for La Penultima in San Juan, Puerto Rico feature a tetrahedral kite. Alexander Graham bell loved tetrahedral kites, and so do the owners of the bar.
Hinds Geophysics Laboratory, 5734 S. Ellis Avenue, Chicago, IL, 60637.
science viz.
geotopics
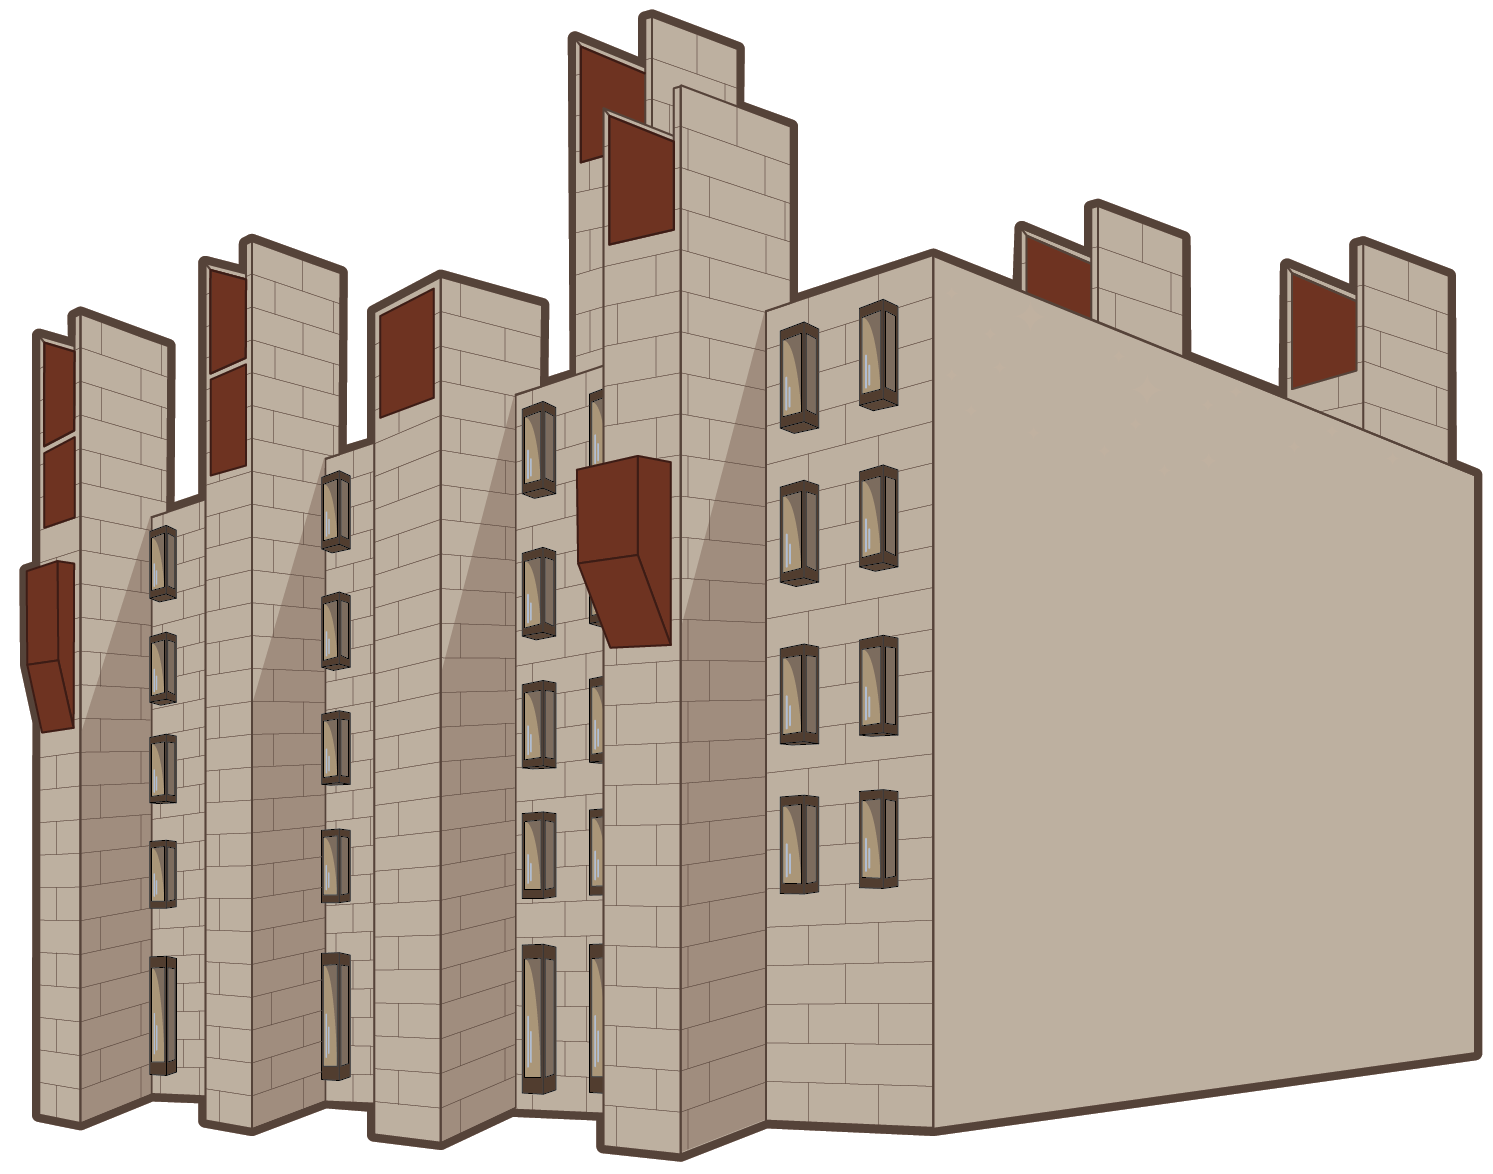
Illustrated Topics in Geophysics is a printed zine I made to teach people about climate science! I distributed it around Chicago!
These are non-consecutive pages from a zine about carbon and the climate. Now that I have a Wacom drawing tablet, I need to re-ink the artwork when I have some downtime, then maybe a republish.
After reading all 12 pages, I hope the reader generally understands what carbon is doing in the atmosphere, and what it means to be a greenhouse gas. Nothing too technical, just fun.
...That said, if the apetite for climate science content keeps up, it might be worth finishing the isometric graphics version of the booklet.
misc.
digital sewing
Sewing is highly algorithmic and mathematical. Well, mine is.
Indie sewing and me-made wardrobes are on the rise, and I am firmly on this bandwagon. I use so much math and geometry in my garment blocks, and on the cutting table in general. I am always testing out ways to improve upon traditional sewing instructions.
Garment construction (not pictured here yet) means turning 2D shapes into a 3D final product. I'm digitizing some of the things I've self-drafted through somewhat traditional flat pattern drafting techniques.
web
http://navah.site
This is only the most recent website in a long line started in text editors in middle school.
Now we call JavaScript 'vanilla JavaScript'. I am nothing if not flexible.
This website uses CSS grid which I prefer to flexbox. I might publish the responsive grid layout because I'm really happy with it.
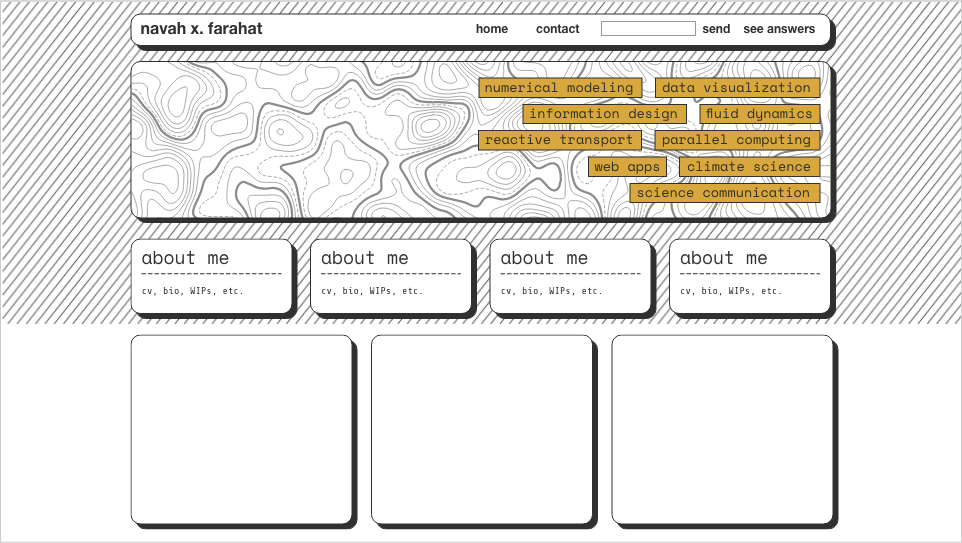
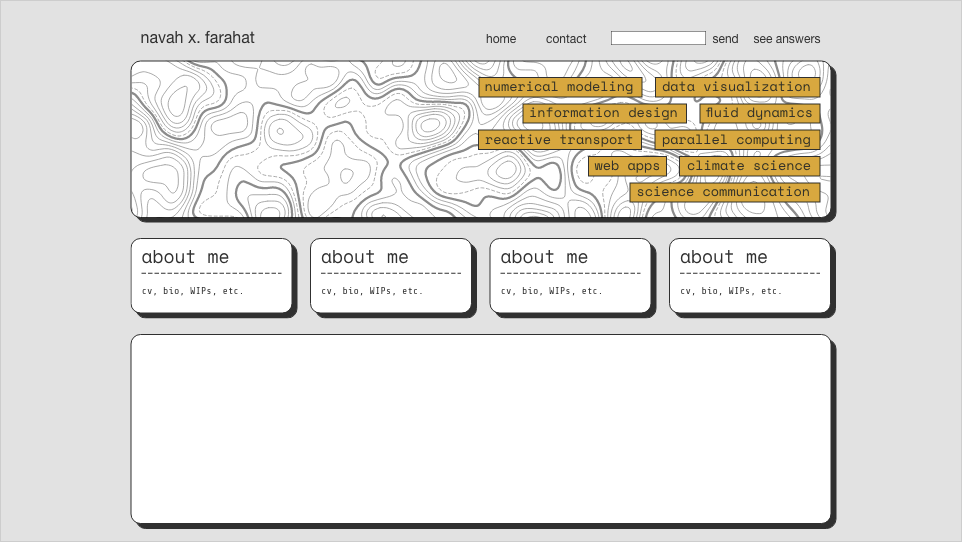
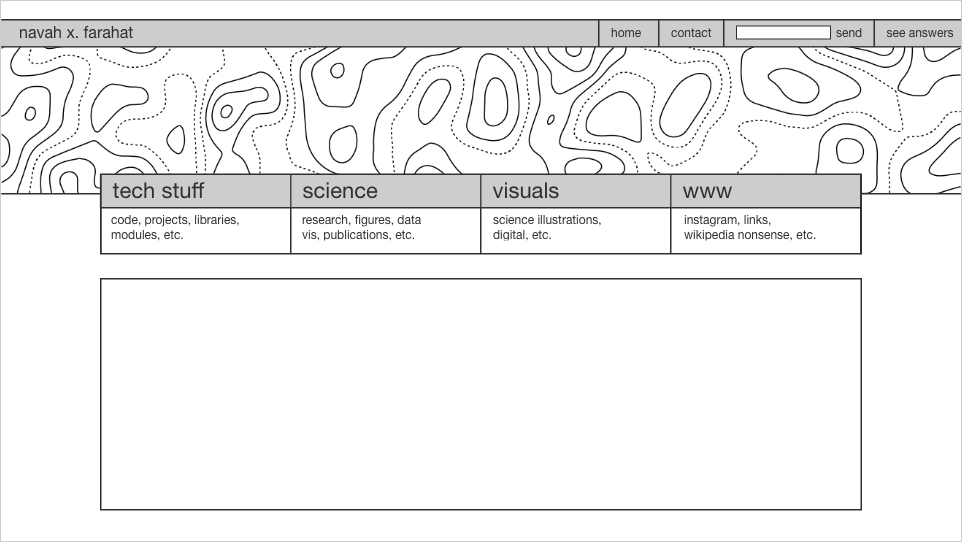
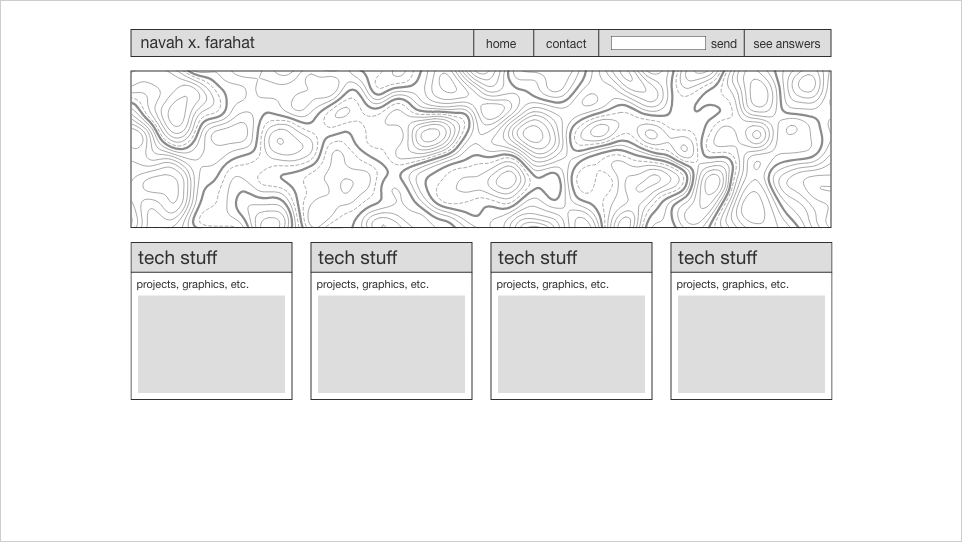
These are some snapshots from wireframing the ugly/brutalist/mid-aughts design of http://navah.site throughout 2020.
This is not a research website, so let's just stick to a few fun aspects of climate science and modeling! If you want details about my research, you can ask me about it or check out my publications and presentations on Google Scholar.
climate science
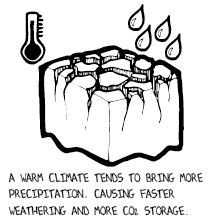
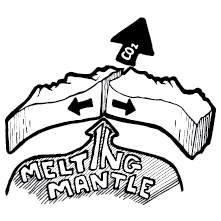
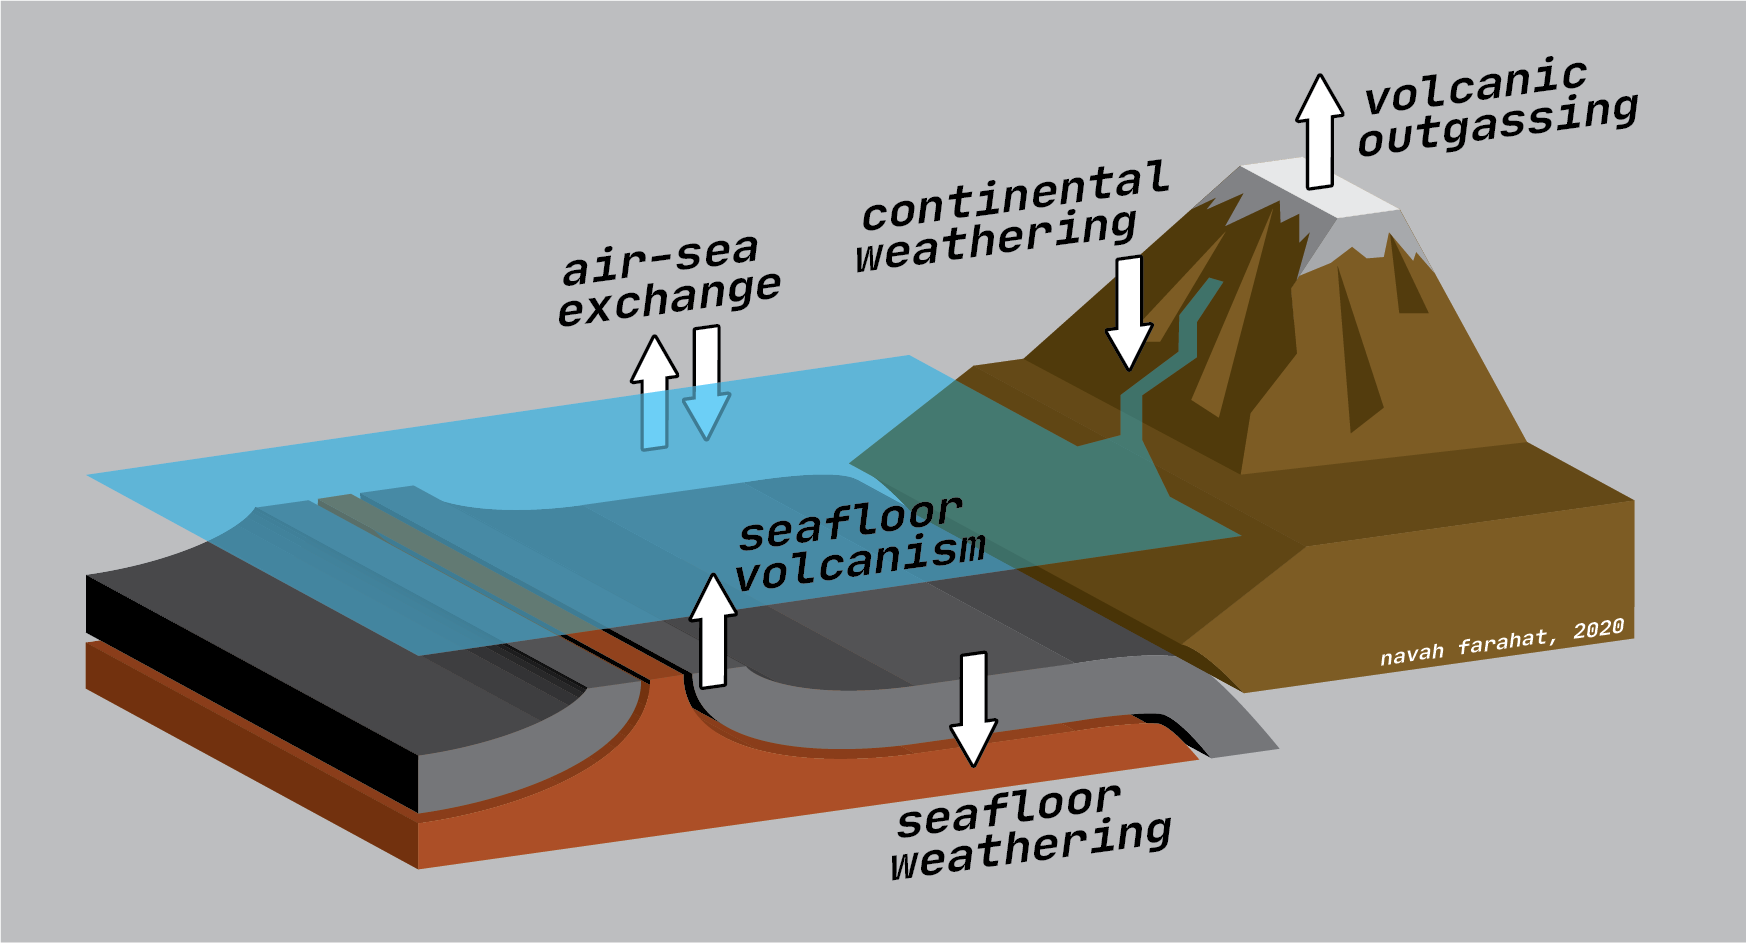
Carbon moves between the Earth's atmosphere, ocean, and crust. This is the inorganic carbon cycle (pictured here) , and it operates over millions of years. Other carbon fluxes happen much more quickly, such as carbon uptake by plants and burning of fossil fuels.
Carbon dioxide (CO 2 ) gas is well known because it impacts the Earth's climate and habitability. All processes that move carbon around can therefore affect the climate! The downward arrow labeled 'seafloor weathering' shows carbon moving from atmosphere to ocean to crust. That has been a research focus of mine.
numerical modeling
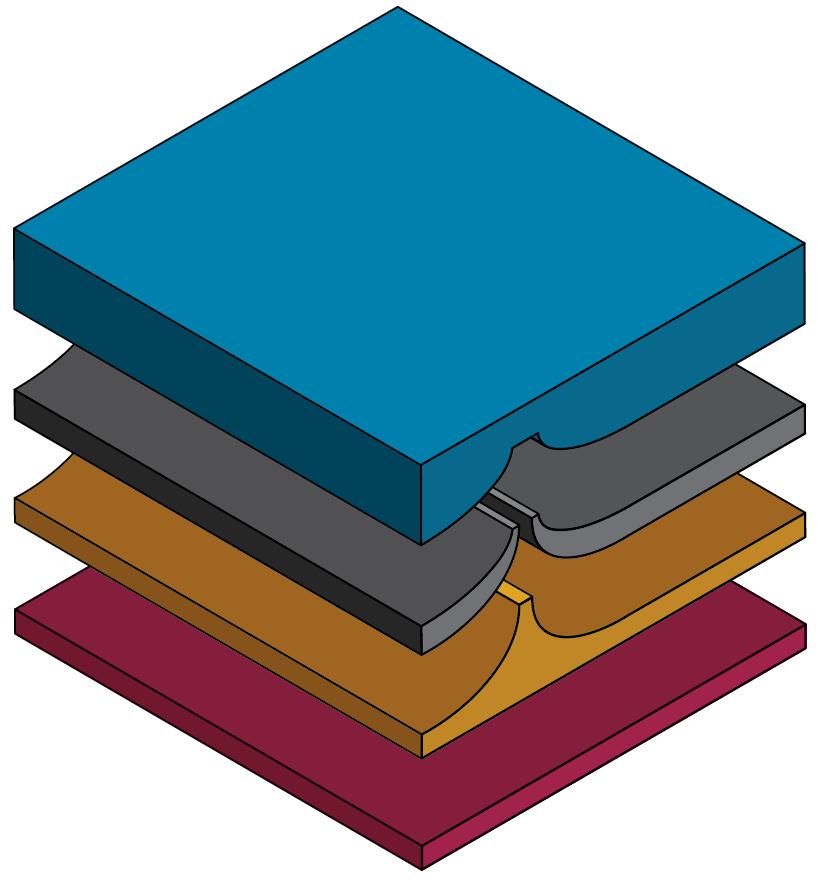
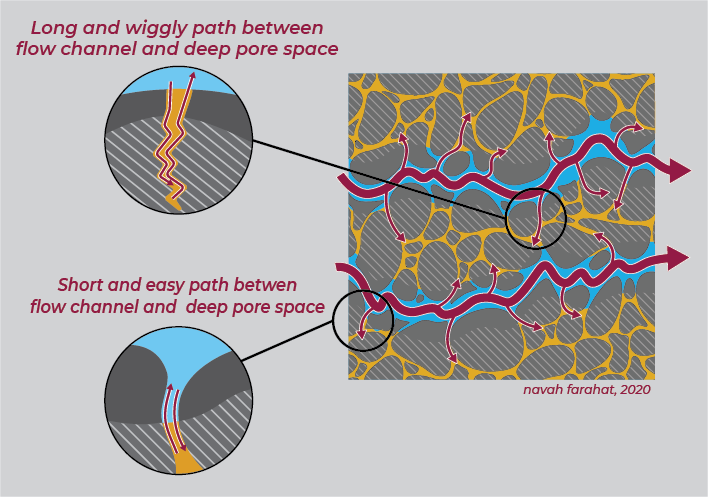
Numerical modeling is a great way to study systems too big or too slow or too inaccessible to observe directly. But deciding the model's scope and detail is an art AND a science.
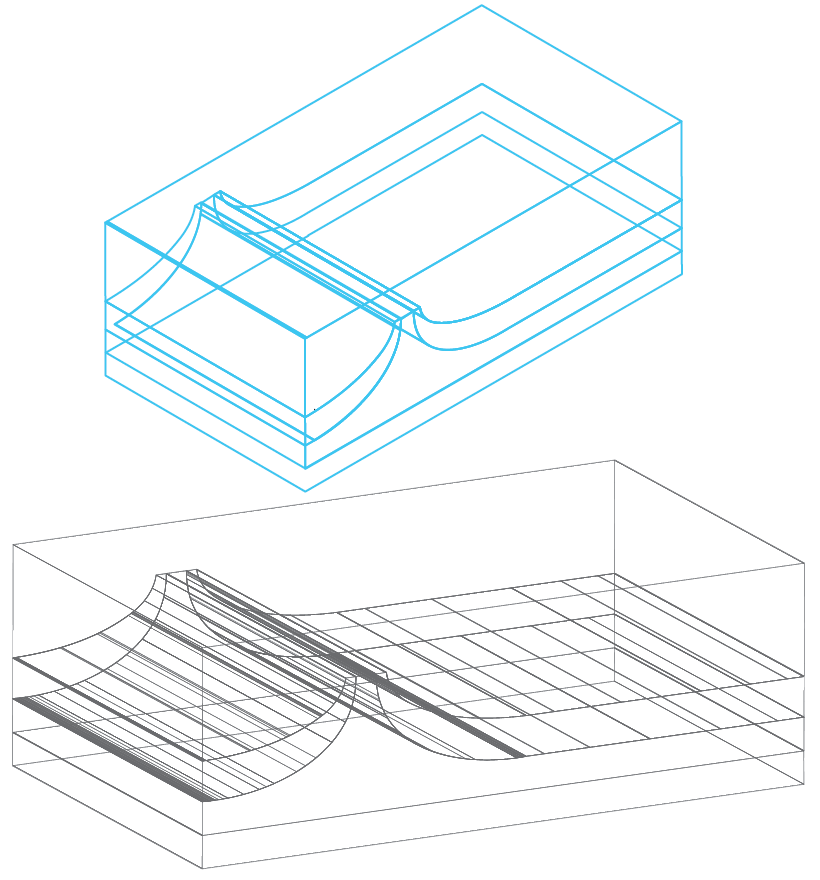
In the second figure, I show a case where I decided it was appropriate to add detail where others have not. In short, reactive fluid travels through a porous medium, and my model added the ability for that fluid to meander into tiny nooks and crannies in the pore space.
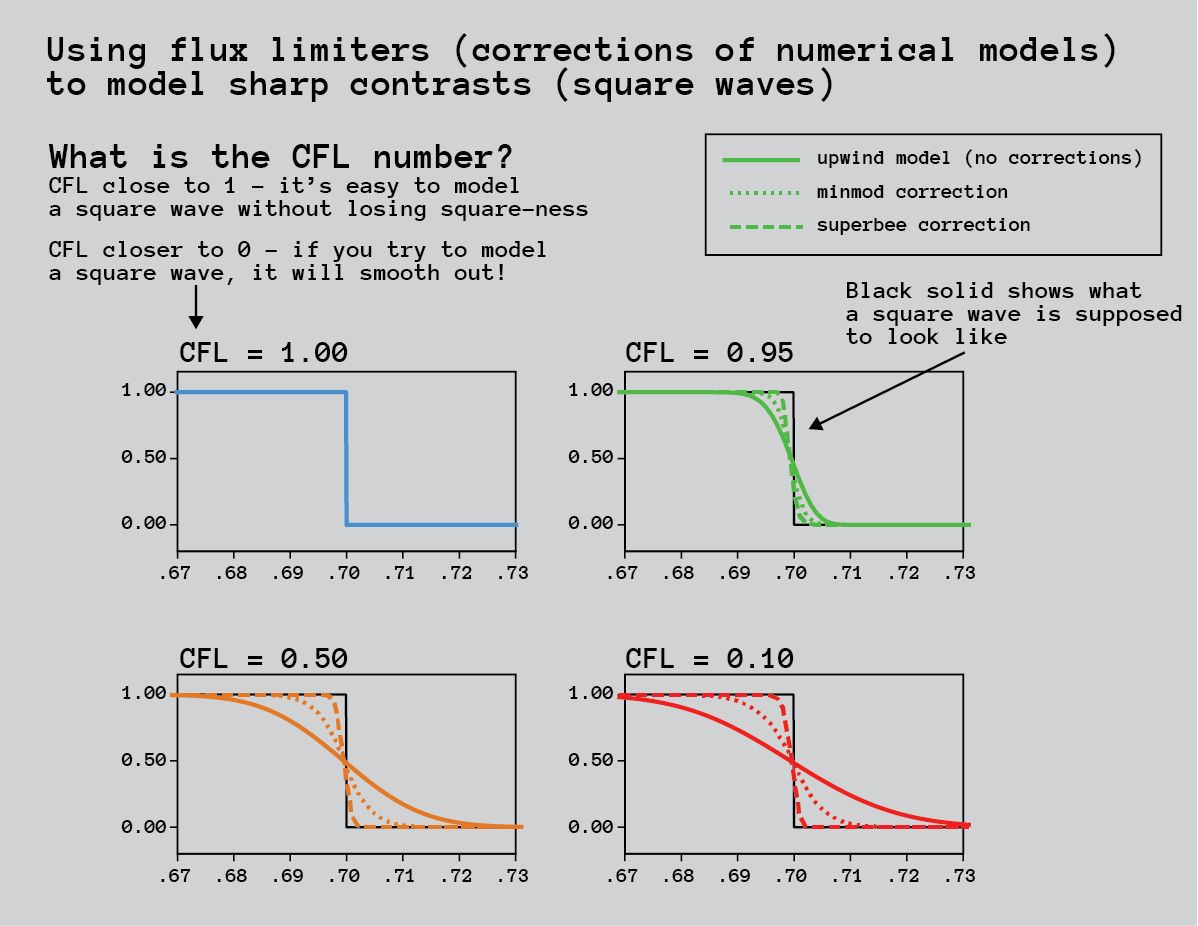
modeling nitty gritty
Numerical modeling needs some basis in reality. Using physical/chemical observations in models is a good start. But how to make sure those observations are translated to the computer without losing meaning along the way?
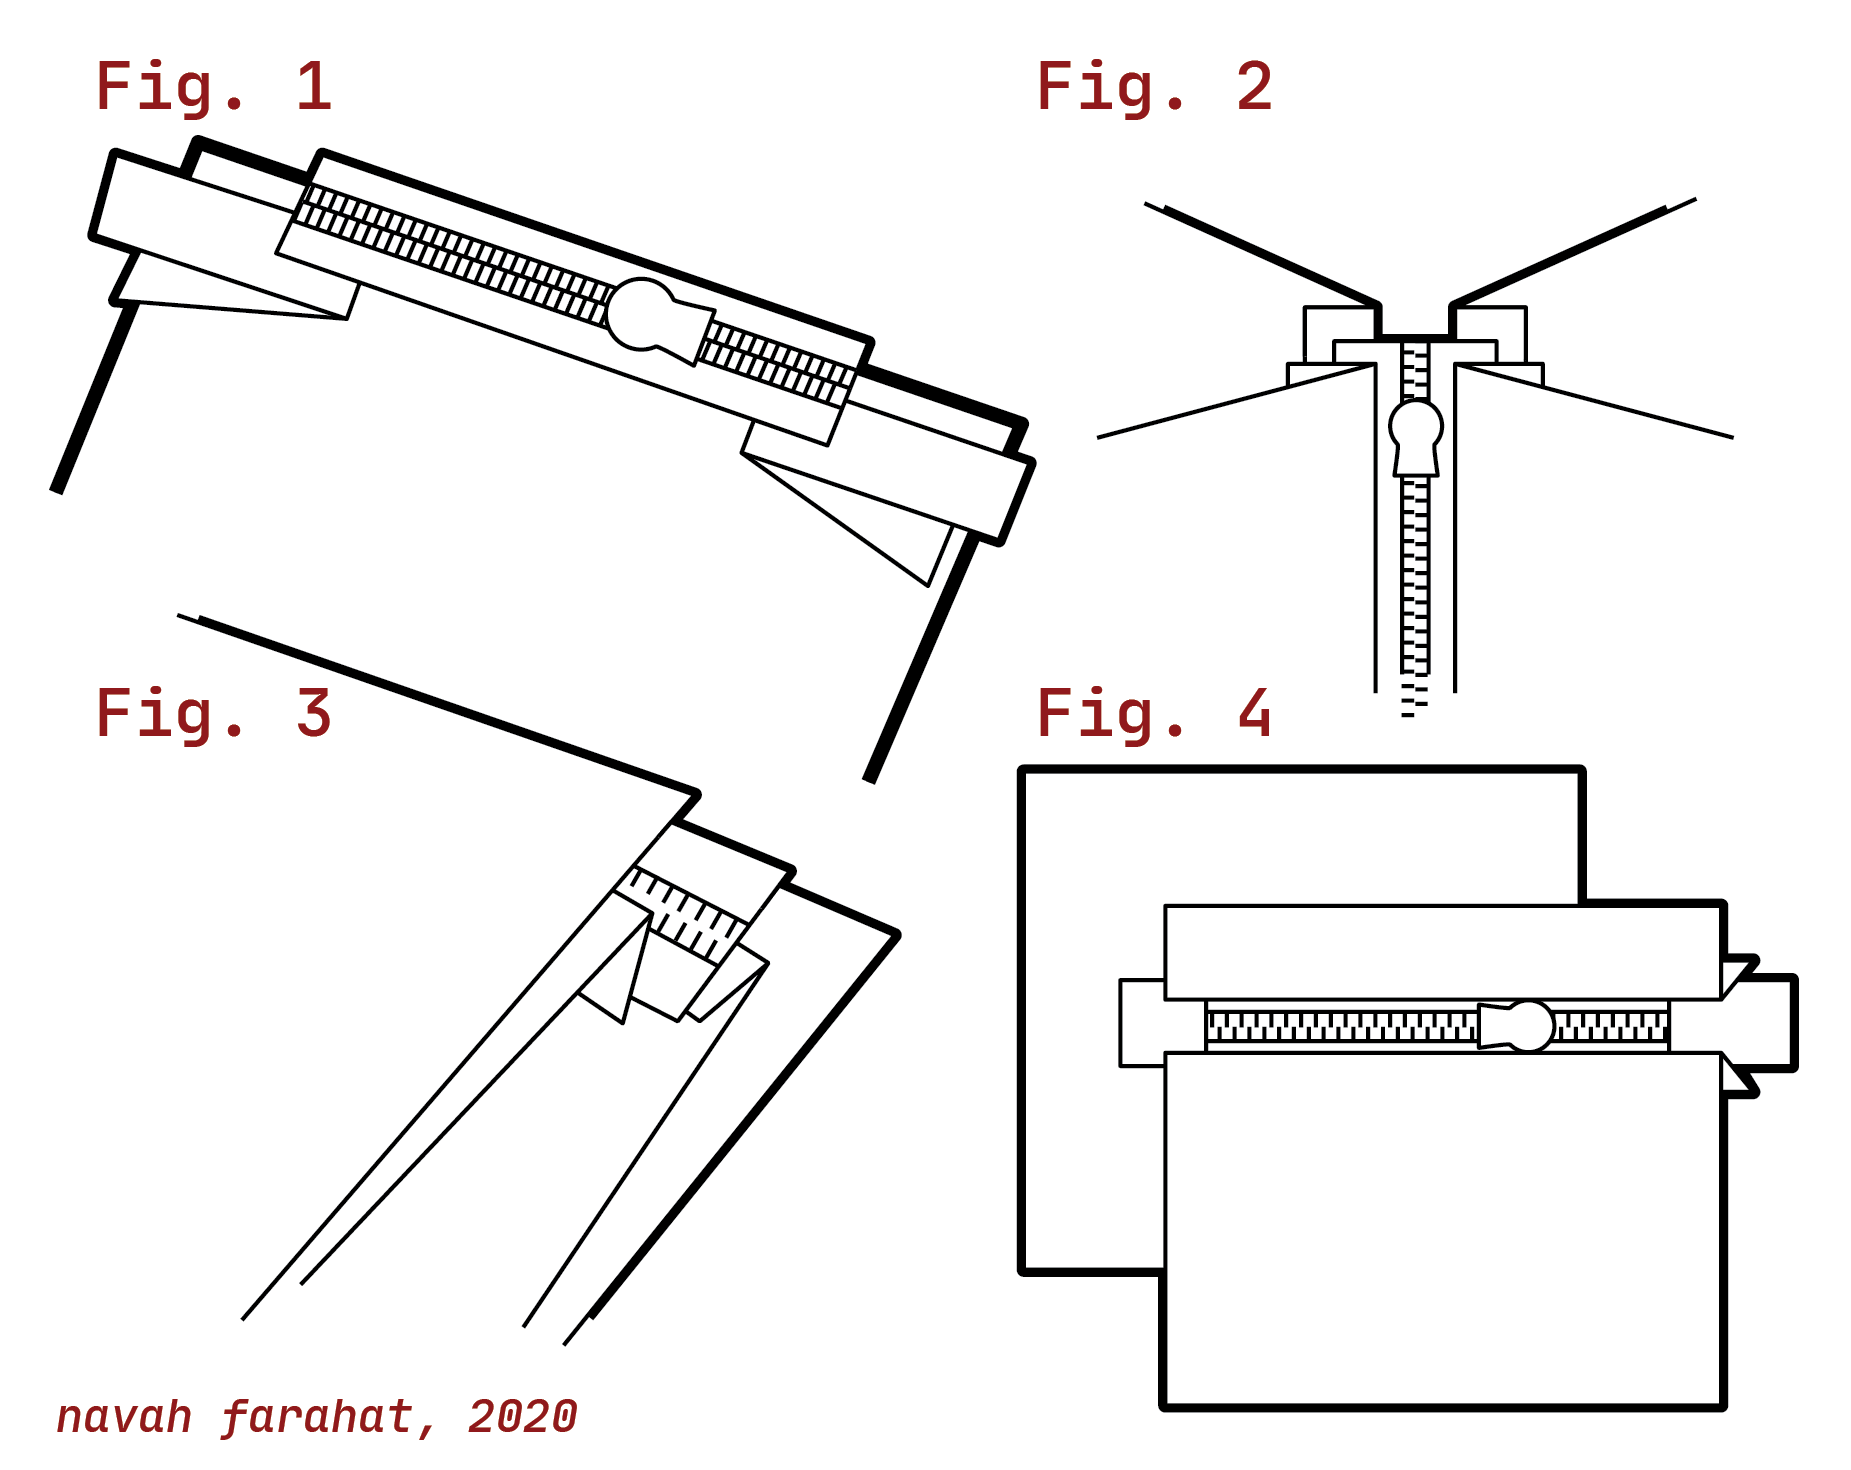
Sometimes we can't, and we have to make corrections afterwards. In many cases, we can predict when and where meaning will be lost so we know how to correct for that. That's what is happening in the third figure.
www
I hope to bring back volcanocams (true heads know) and the Wikipedia collection.
Google Scholar profile for publications, presentations, and other contributions to science
github.com/navah for projects and bits and pieces (actually most of this is set to private for the time being as of 2024 as I move some stuff around)
contact me
Feel free to contact me by email, it's my first name three times, with no spaces, @gmail.com
You can use the following form to send me an email, anonymously or with your information. If you have noticed any bugs on this website, I would love to know about them! It can be vague, such as "animations are jumpy on mobile".
Follow the Czech-box related instructions so your message actually gets through the spam-deleter; I have gotten all the good spam already.
Thank you :)